
15 Richest African Countries by GDP, Economy, Export
In the past few years, African countries have been doing a great job of building their economies and becoming an attractive destinations for tourists.
In fact, some countries in Africa have become so prosperous that they are much wealthier than you would expect. This blog post is to highlight those places where you can find real wealth on this continent!
In this list of the richest countries in Africa, we explain their economy situation and list the main exports and GDP sector distribution.
Obsah / Contents
How to determine the richest countries in Africa?
The most common metrics to determine the wealthiest countries are GDP, nominal GDP per capita, and GDP (PPP) per capita. Here is a short explanation:
- GDP – Gross domestic product is the market value of all final goods and services from a nation in a given year.
- GDP (nominal) per capita – GDP divided by the number of country’s inhabitants
- GDP (PPP) per capita – GDP at purchasing power parity. This metric basically additionally takes into account the cost of living in the country.
The GDP values in this article are based on International Monetary Fund 2021 estimates [source].
The richest African countries by GDP
First, let’s have a look at the richest countries in Africa by GDP:
1) Nigeria (GDP – 514,049 mil. USD)
| Value | Global Ranking | |
|---|---|---|
| GDP (mil. USD) | 514,049 | 26th |
| GDP (nominal) per capita (USD) | 2,432 | 136th |
| GDP (PPP) per capita (USD) | 5,280 | 136th |
| Population | 211,401,000 | 7th |
- GDP by sector: agriculture: 21.96%, industry: 23.65%, services: 54.39%
- Main exports: petroleum and petroleum products, chemicals, vehicles, aircraft parts, vessels, vegetable products, processed food
Nigeria has been an economic powerhouse in Africa for decades. It’s a country with the 7th largest population in the world with more than 170 million people, which accounts for about 1/5 of all African populations.
Nigeria’s economy relies heavily on oil, which accounts for about 90% of its exports and 70% of government revenue.
However, oil prices have been dropping in recent years, therefore the Nigerian government has tried to diversify its economy but there are many obstacles for them to overcome such as infrastructure problems and corruption issues.
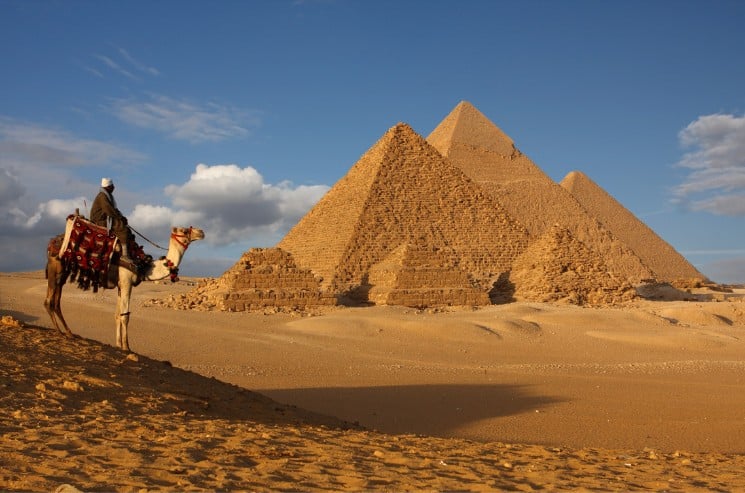
2) Egypt (GDP – 394,284 mil. USD)
| Value | Global Ranking | |
|---|---|---|
| GDP (mil. USD) | 394,284 | 34th |
| GDP (nominal) per capita (USD) | 3,832 | 112th |
| GDP (PPP) per capita (USD) | 13,083 | 94th |
| Population | 101,804,299 | 14th |
- GDP by sector: agriculture: 11.7%, industry: 34.3%, services: 54%
- Main exports: petroleum products, cotton, textiles, metal products, chemicals, agricultural goods
The economy of Egypt relies heavily on tourism and agriculture, which account for about 20% and 10% of its GDP respectively. Tourism makes up approximately 12% of all employment in Egypt as well.
The Egyptian economy has always been a difficult one to analyze. The country’s economy relies also on remittances from Egyptians working abroad and oil imports, but the recent political instability makes these sources of income uncertain.
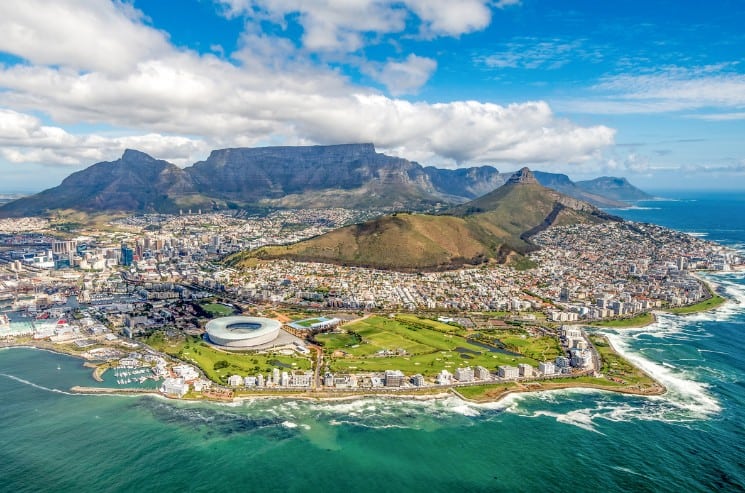
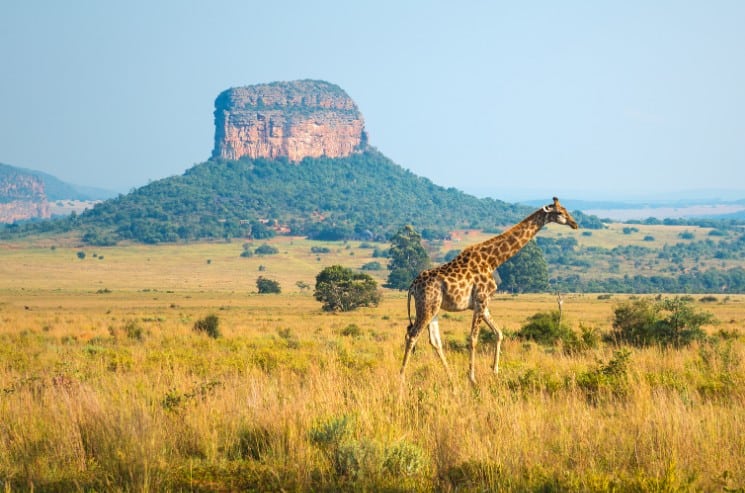
3) South Africa (GDP – 329,529 mil. USD)
- GDP by sector: agriculture: 2.8%, industry: 29.7%,services: 67.5%
- Main exports: gold, diamonds, wines, iron ore, platinum, nonferrous metals, electronics, machinery and manufactured equipment, motor vehicles
| Value | Global Ranking | |
|---|---|---|
| GDP (mil. USD) | 329,529 | 40th |
| GDP (nominal) per capita (USD) | 5,444 | 91st |
| GDP (PPP) per capita (USD) | 12,442 | 99th |
| Population | 59,622,350 | 23rd |
The South African relies heavily on mining, manufacturing, and service industries.
The country’s economic development has been hampered by lack of access to funding for small businesses; high costs of labor and capital investment; inadequate skills training for workers; political instability; policy uncertainty around privatization initiatives (such as electricity); restrictive trade policies that limit exports to other countries; under-developed transportation infrastructure (roads and rail systems); a shortage of skilled managers with business experience in the private sector
South Africa’s economy is facing many challenges due to an aging population, poor education system, poverty levels increase from 22% in 1994 to 40% today.
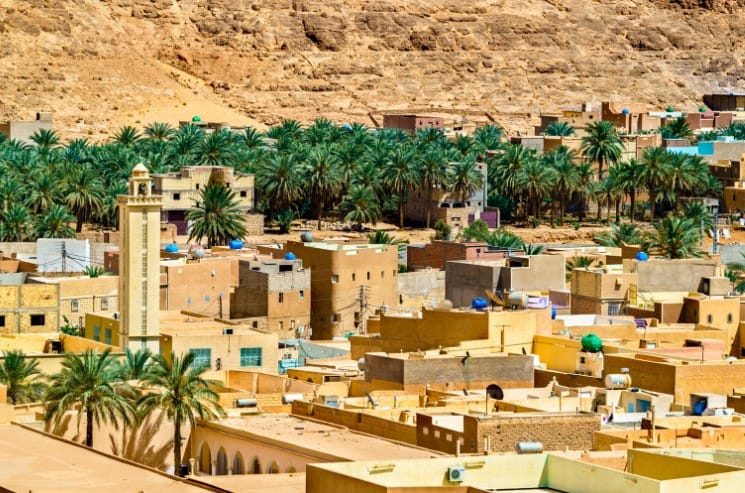
4) Algeria (GDP – 151,459 mil. USD)
| Value | Global Ranking | |
|---|---|---|
| GDP (mil. USD) | 151,459 | 56th |
| GDP (nominal) per capita (USD) | 3,364 | 124th |
| GDP (PPP) per capita (USD) | 11,433 | 105th |
| Population | 44,700,000 | 32nd |
petroleum, natural gas and petroleum products- GDP by sector: agriculture: 13.3%, industry: 39.3%, services: 47.4%
- Main exports: petroleum, natural gas and petroleum products
The Algerian economy is mostly based on oil and natural gas production. In the past few years, Algeria’s economic growth has been declining due to falling global oil prices. Algeria has plenty of natural resources in its territory but it lacks industrialization and a strong agricultural sector.
Oil and gas revenues account for roughly 45% of GDP. The country is part of OPEC and was one of the founding members.
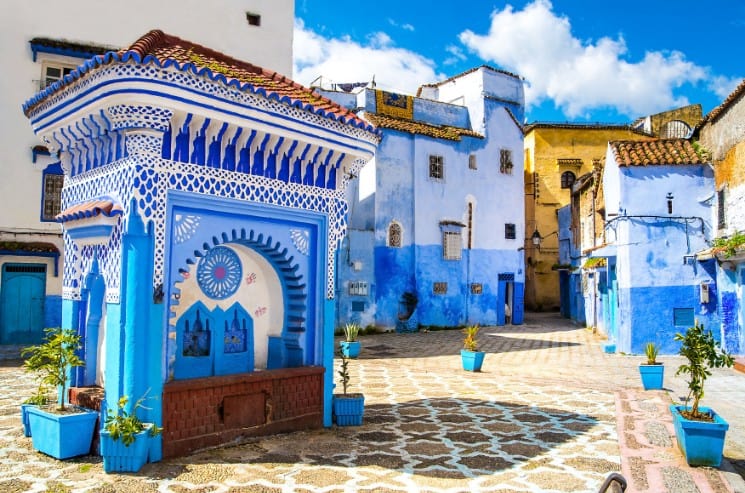
5) Morocco (GDP – 124,003 mil. USD)
| Value | Global Ranking | |
|---|---|---|
| GDP (mil. USD) | 124,003 | 58th |
| GDP (nominal) per capita (USD) | 3,415 | 123rd |
| GDP (PPP) per capita (USD) | 8,027 | 120th |
| Population | 36,234,708 | 39th |
- GDP by sector: agriculture: 14.8%, industry: 29.1%, services: 56%
- Main exports: clothing and textiles, automobiles, aircraft parts, electric components, inorganic chemicals, transistors, crude minerals
Morocco is a country with an economy that relies heavily on tourism and agriculture. The Moroccan government has been working to diversify the economy by investing in new industries such as renewable energy, information technology, construction, transportation, and manufacturing.
The Moroccan people have traditionally relied on their agricultural sector for employment and income so the shift towards other industries can be difficult for some of them. Other challenges include trying to create jobs in areas where there are few skills available or lack of education opportunities nearby.
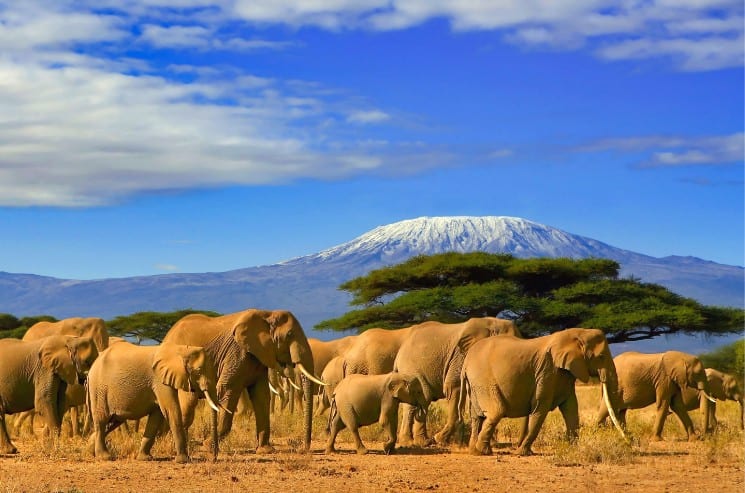
6) Kenya (GDP – 106,041 mil. USD)
| Value | Global Ranking | |
|---|---|---|
| GDP (mil. USD) | 106,041 | 60th |
| GDP (nominal) per capita (USD) | 2,129 | 142nd |
| GDP (PPP) per capita (USD) | 5,274 | 137th |
| Population | 47,564,296 | 29th |
- GDP by sector: Agriculture: 34.5%, Industry: 17.8%, Services: 47.5%
- Main exports: Small-scale consumer goods (plastic, furniture, batteries, textiles, clothing, soap, cigarettes, flour), agricultural products
Kenya’s economy relies heavily on agriculture. It is the mainstay of the country, employing about 72% of Kenyans and contributing 25% to Kenya’s GDP. Agriculture also makes up more than half of export earnings.
The Kenyan government is working hard to revive its economy through various means including infrastructure development and agricultural diversification. With so much potential for growth in these areas, Kenya is poised to achieve significant success as it moves into the future.
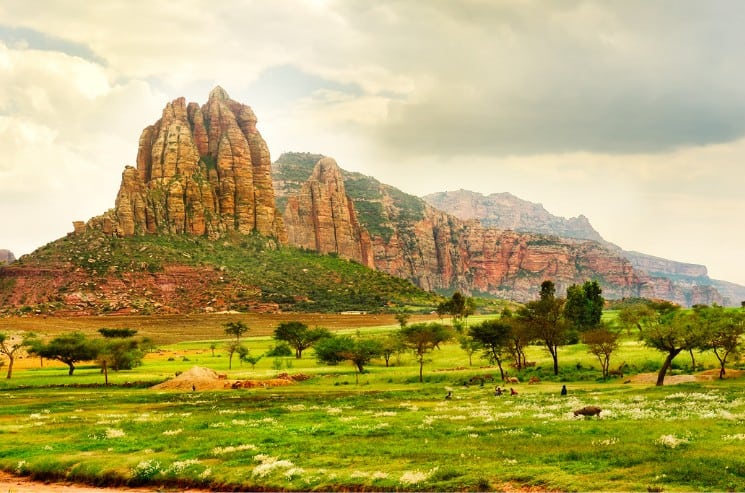
7) Ethiopia (GDP – 93,966 mil. USD)
| Value | Global Ranking | |
|---|---|---|
| GDP (mil. USD) | 93,966 | 63rd |
| GDP (nominal) per capita (USD) | 952 | 167th |
| GDP (PPP) per capita (USD) | 2,973 | 158th |
| Population | 117,876,000 | 12th |
- GDP by sector: Agriculture: 34.8%, Industry: 21.6%, Services: 43.6%
- Main exports: coffee, qat, gold, leather products, live animals, oilseeds
Ethiopia belongs to the richest African countries just by total value because it’s so huge! It’s the second-most populous country in Africa (behind just Nigeria) and 13th most populous in the entire world.
Ethiopia has been struggling to establish a healthy and sustainable economy for decades. Per capita, it is one of the poorest countries in the world, with an average per capita income of less than $1 USD per day.
The country relies heavily on agriculture, which accounts for more than 40% of GDP and 80% of employment. However, Ethiopia’s climate limits agricultural productivity through cycles of severe drought followed by floods that destroy crops and livestock.
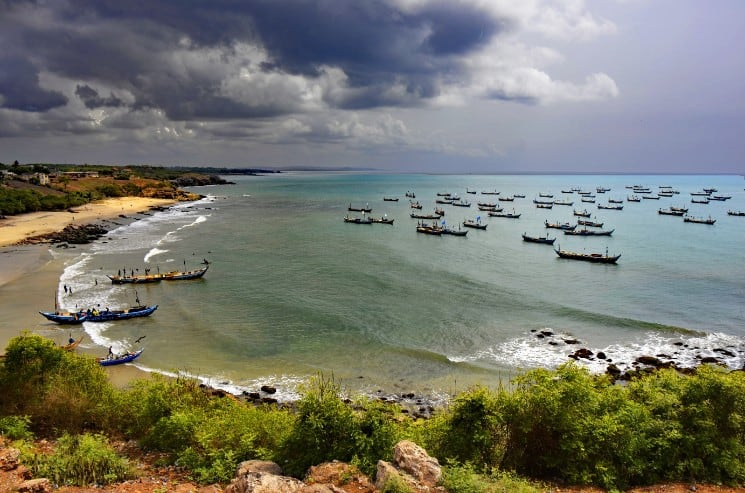
8) Ghana (GDP – 74,260 mil. USD)
| Value | Global Ranking | |
|---|---|---|
| GDP (mil. USD) | 74,260 | 70th |
| GDP (nominal) per capita (USD) | 2,374 | 137th |
| GDP (PPP) per capita (USD) | 5,968 | 129th |
| Population | 30,955,202 | 46th |
- GDP by sector: agriculture: 18.3%, industry: 24%, services: 57.2%
- Main exports: oil, gold, cocoa, timber, tuna, bauxite, aluminum, manganese ore, diamonds, horticultural products
The Ghanaian economy is one of the fastest-growing economies in the world and it relies on a variety of industries to function. The service sector, which accounts for about three-quarters of GDP, includes tourism, mining, construction, communications, and financial services.
Low prices in cocoa and oil production have negatively impacted Ghana’s economy over the last few years.
9) Ivory Coast (Côte d’Ivoire) (GDP – 70,991 mil. USD)
| Value | Global Ranking | |
|---|---|---|
| GDP (mil. USD) | 70,991 | 72nd |
| GDP (nominal) per capita (USD) | 2,567 | 133rd |
| GDP (PPP) per capita (USD) | 5,642 | 124th |
| Population | 27,087,732 | 51st |
- GDP by sector: agriculture: 20.1%, industry: 26.6%, services: 53.3%
- Main exports: cocoa beans, gold, rubber, refined petroleum, crude petroleum
With a population of over 20 million people, Ivory Coast is the largest economy in West Africa. This economic powerhouse has been growing at an impressive rate in recent years and now ranks as one of the fastest-growing economies on the continent.
The country’s success can be attributed to its diversified manufacturing sector, which includes textiles and food processing among other industries that make up 18% of GDP. In addition, oil production accounts for more than half of all exports from the Ivory Coast.
Finally, despite some setbacks caused by political instability in recent years, tourism remains an important contributor to economic growth.
10) Angola (GDP – 66,493 mil. USD)
| Value | Global Ranking | |
|---|---|---|
| GDP (mil. USD) | 66,493 | 73th |
| GDP (nominal) per capita (USD) | 2,080 | 143rd |
| GDP (PPP) per capita (USD) | 6,878 | 123rd |
| Population | 32,097,671 | 45th |
- GDP by sector: agriculture: 10.2%, industry: 61.4%, services: 28.4%
- Main exports: crude oil, diamonds, refined petroleum products, coffee, sisal, fish and fish products, timber, cotton
The Angolan economy is largely dependent on the oil industry. Angola was a founding member of OPEC and has the third-largest proven oil reserves in Africa, behind Nigeria and Libya.
The country’s GDP depends heavily on its export revenue from petroleum sales, which amounts to roughly 80% of all exports earned by the nation.
11) Tanzania (GDP – 65,919 mil. USD)
| Value | Global Ranking | |
|---|---|---|
| GDP (mil. USD) | 65,919 | 74th |
| GDP (nominal) per capita (USD) | 1,104 | 162nd |
| GDP (PPP) per capita (USD) | 2,863 | 160th |
| Population | 59,441,988 | 24th |
- GDP by sector: agriculture: 23.4%, industry: 28.6%, services: 47.6%
- Main exports: gold, manufactured goods, tobacco, fish products, coffee, cashew, cotton, cove
The Tanzanian economy relies heavily on agriculture and tourism. The country is rich just by total values. It has on $1,100 GDP per capita. Agriculture accounts for about 23% of GDP and employs 80% of the population.
Historically, Tanzania has been an exporter of agricultural products to other countries such as India. Tourism provides a more stable source of income than agriculture because it has less variability from year-to-year and seasonality issues that can affect crop yields.
12) Democratic Republic of the Congo (GDP – 55,088 mil. USD)
| Value | Global Ranking | |
|---|---|---|
| GDP (mil. USD) | 55,088 | 85th |
| GDP (nominal) per capita (USD) | 588 | 180th |
| GDP (PPP) per capita (USD) | 1,132 | 183rd |
| Population | 92,378,000 | 16th |
- GDP by sector: agriculture: 44.2%, industry: 22.6%, services: 33.1%
- Main exports: gold, diamonds, copper, cobalt, coltan, zinc, tin, tungsten, crude oil, wood products, coffee
The Democratic Republic of the Congo (DRC) is one of the world’s most resource-rich countries. It holds an estimated $24 trillion worth of mineral and oil wealth, including gold, diamonds, copper and uranium.
However, these resources have not benefited DRC citizens. In fact, they are a major cause for concern as poverty rates in this country are among the highest in Africa.
The lack of economic development has led to widespread corruption and conflict both internally within the government as well as externally with neighboring countries such as Rwanda and Uganda which border it on all sides but one.
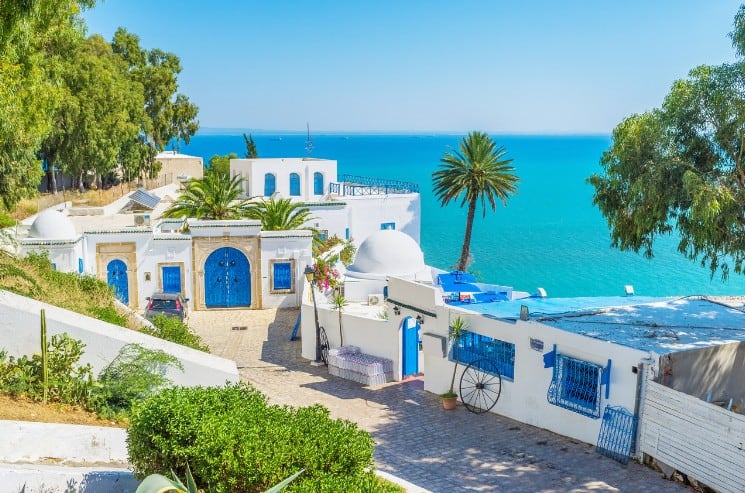
13) Tunisia (GDP – 44,265 mil. USD)
| Value | Global Ranking | |
|---|---|---|
| GDP (mil. USD) | 44,265 | 90th |
| GDP (nominal) per capita (USD) | 3,683 | 116th |
| GDP (PPP) per capita (USD) | 10,594 | 108th |
| Population | 11,746,695 | 80th |
- GDP by sector: agriculture: 10.1%, industry: 26.2%, services: 63.8%
- Main exports: clothing, semi-finished goods and textiles, agricultural products, mechanical goods, phosphates and chemicals, hydrocarbons, electrical equipment
The Tunisian economy relies on the tourism sector, agriculture, and trade. The country is a net importer of products from abroad.
It imports food items such as wheat, livestock, and dairy products for consumption and to support its own agricultural production.
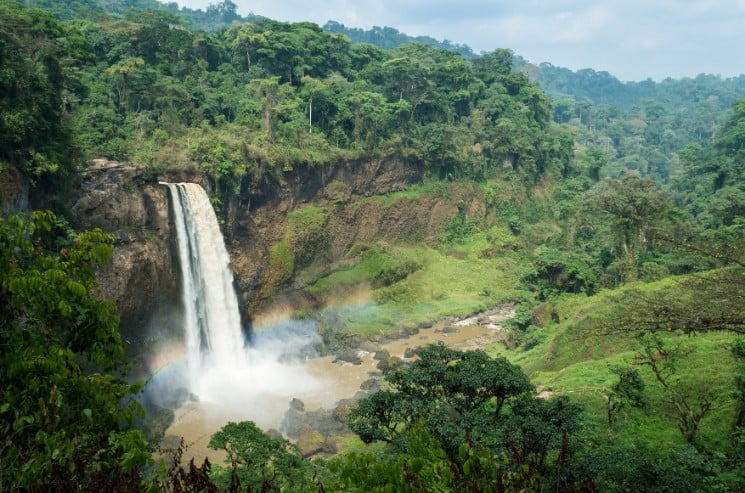
14) Cameroon (GDP – 44,893 mil. USD)
| Value | Global Ranking | |
|---|---|---|
| GDP (mil. USD) | 44,893 | 89th |
| GDP (nominal) per capita (USD) | 1,649 | 150th |
| GDP (PPP) per capita (USD) | 3,745 | 151st |
| Population | 24,348,251 | 55th |
- GDP by sector: agriculture: 16.7%, industry: 26.5%, services: 56.8%
- Main exports: crude oil and petroleum products, lumber, cocoa beans, aluminium, coffee, cotton
Cameroon’s economy relies heavily on the production of cocoa beans and coffee. The country is also rich in natural resources such as oil, gas, uranium, coal, timber, and gold reserves.
However, Cameroon has struggled to maintain a sustainable economic growth rate due to high inflation rates.
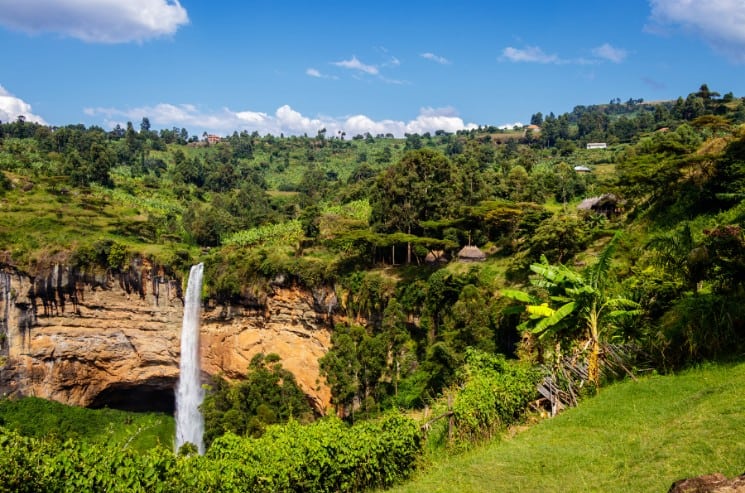
15) Uganda (GDP – 41,271 mil. USD)
| Value | Global Ranking | |
|---|---|---|
| GDP (mil. USD) | 41,271 | 93th |
| GDP (nominal) per capita (USD) | 972 | 166th |
| GDP (PPP) per capita (USD) | 2,706 | 163rd |
| Population | 42,885,900 | 34th |
- GDP by sector: Agriculture: 71.9%, Industry: 4.4%, Services: 23.7%
- Main exports: coffee, fish and fish products, tea, cotton, flowers, horticultural products, gold
The Ugandan economy has relied on agriculture and tourism for decades. However, these industries are not enough to sustain the country’s growth.
Uganda needs to develop new industries that will create jobs and help reduce poverty. The government is trying to encourage investment in the manufacturing and mining sectors, but it could take many years before these efforts have a significant impact on the country’s economic growth.
The richest African countries by GDP per capita
Seconly, let’s have a look at the richest countries in Africa by GDP per capita:
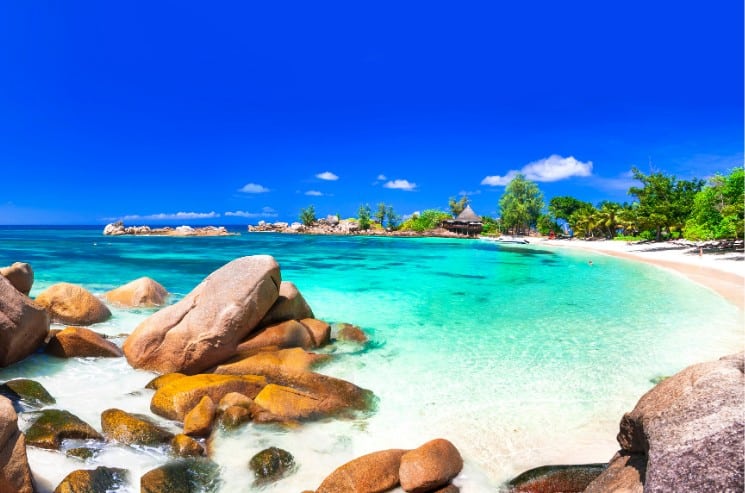
1) Seychelles (GDP per capita – 9,666 USD)
| Million USD | Global Ranking | |
|---|---|---|
| GDP (mil. USD) | 948 | 179th |
| GDP (nominal) per capita (USD) | 9,666 | 65th |
| GDP (PPP) per capita (USD) | 26,119 | 53rd |
| Population | 98,963 | 184th |
- GDP by sector: agriculture: 2.5%, industry: 13.8%, services: 83.7%
- Main exports: canned tuna, frozen fish, petroleum products (reexports)
The Seychelles economy is heavily reliant on the presence of foreign financiers and tourists. In turn, this reliance has created a dependency on tourism.
Seychelles is an ideal tourist destination due to its location in the Indian Ocean; its proximity to Europe and America makes it a convenient stop for travelers before they head home.
Otherwise, the Seychelles are a small country, with very few natural resources to speak of.
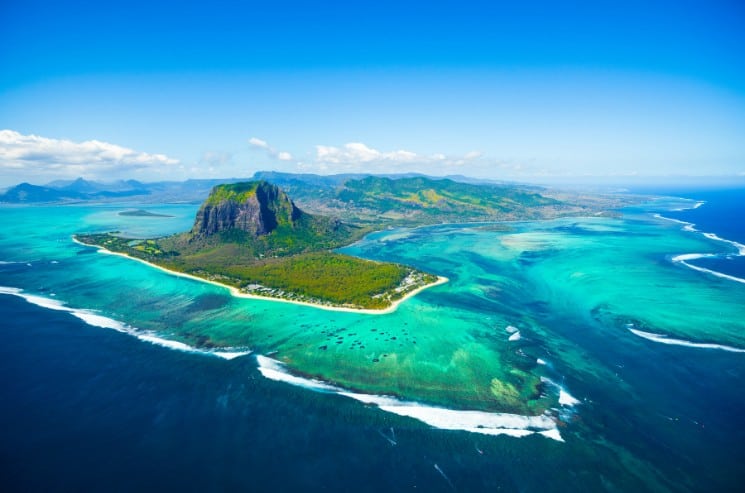
2) Mauritius (GDP per capita – 9,639 USD)
| Million USD | Global Ranking | |
|---|---|---|
| GDP (mil. USD) | 12,212 | 137th |
| GDP (nominal) per capita (USD) | 9,639 | 66th |
| GDP (PPP) per capita (USD) | 22,030 | 61st |
| Population | 1,266,030 | 154th |
- GDP by sector: agriculture: 4%, industry: 21.8%, services: 74.1%
- Main exports: clothing and textiles, sugar, cut flowers, molasses, fish, primates (for research)
Mauritius, one of the most successful economies in Africa and a rising star on the world stage, has become an example for other African countries. Mauritian economy relies heavily on tourism and textiles which account for over 60% of its GDP.
Mauritius exports sugar, textiles, garments, and other goods to many countries around the world.
3) Gabon (GDP per capita – 8,601 USD)
| Million USD | Global Ranking | |
|---|---|---|
| GDP (mil. USD) | 18,362 | 120th |
| GDP (nominal) per capita (USD) | 8,601 | 75th |
| GDP (PPP) per capita (USD) | 16,244 | 76th |
| Population | 2,233,272 | 143rd |
- GDP by sector: agriculture: 60%; industry: 15%; services: 25%
- Main exports: crude oil, timber, manganese, uranium
Gabon is a small country in Central Africa, which has managed to become one of the fastest developing countries.
Gabonese economy relies heavily on its oil production and exports, as well as being one of the largest exporters of manganese in the world.
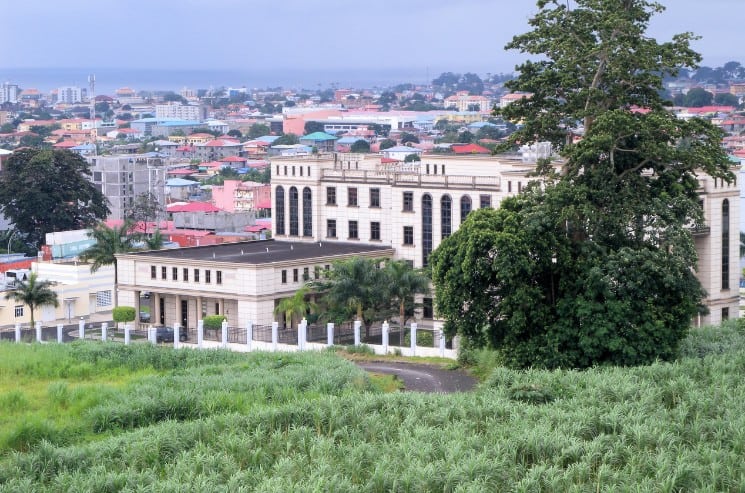
4) Equatorial Guinea (GDP per capita – 8,074 USD)
| Million USD | Global Ranking | |
|---|---|---|
| GDP (mil. USD) | 11,726 | 140th |
| GDP (nominal) per capita (USD) | 8,074 | 76th |
| GDP (PPP) per capita (USD) | 18,236 | 71st |
| Population | 1,505,588 | 149th |
- GDP by sector: agriculture: 4.6%, industry: 87.3%, services: 8.1%
- Main exports: petroleum, fish
Equatorial Guinea’s economy is heavily reliant on the production of oil and natural gas. The country has been ranked as one of the wealthiest African countries in terms of GDP per capita.
However, it ranks poorly in other categories such as poverty rate, life expectancy, infant mortality rates, malnutrition rates, and literacy rates.
5) Botswana (GDP per capita – 7,817 USD)
| Million USD | Global Ranking | |
|---|---|---|
| GDP (mil. USD) | 18,726 | 119th |
| GDP (nominal) per capita (USD) | 7,817 | 79th |
| GDP (PPP) per capita (USD) | 18,113 | 73rd |
| Population | 2,410,338 | 141st |
- GDP by sector: agriculture: 1.8%, industry: 27.5%, services: 70.6%
- Main exports: diamonds, copper, nickel, soda ash, beef, textiles
The economy of Botswana relies heavily on diamond mining, which accounts for a large percentage of the country’s GDP. This reliance is due to the fact that diamonds are found in abundance and make up most of the exports from Botswana.
Other major export commodities are copper ore, nickel ore and coal.
6) South Africa (GDP per capita – 5,444 USD)
- GDP by sector: agriculture: 2.8%, industry: 29.7%,services: 67.5%
- Main exports: gold, diamonds, wines, iron ore, platinum, nonferrous metals, electronics, machinery and manufactured equipment, motor vehicles
| Value | Global Ranking | |
|---|---|---|
| GDP (mil. USD) | 329,529 | 40th |
| GDP (nominal) per capita (USD) | 5,444 | 91st |
| GDP (PPP) per capita (USD) | 12,442 | 99th |
| Population | 59,622,350 | 23rd |
The South African relies heavily on mining, manufacturing, and service industries.
The country’s economic development has been hampered by lack of access to funding for small businesses; high costs of labor and capital investment; inadequate skills training for workers; political instability; policy uncertainty around privatization initiatives (such as electricity); restrictive trade policies that limit exports to other countries; under-developed transportation infrastructure (roads and rail systems); a shortage of skilled managers with business experience in the private sector
South Africa’s economy is facing many challenges due to an aging population, poor education system, poverty levels increase from 22% in 1994 to 40% today.
7) Namibia (GDP per capita – 4,371 USD)
| Million USD | Global Ranking | |
|---|---|---|
| GDP (mil. USD) | 11,381 | 142nd |
| GDP (nominal) per capita (USD) | 4,371 | 101st |
| GDP (PPP) per capita (USD) | 9,542 | 113rd |
| Population | 2,550,226 | 140th |
- GDP by sector: agriculture: 6.3%, industry: 26.3%, services: 67%
- Main exports: diamonds, copper, gold, zinc, lead, uranium; cattle, white fish and mollusks
Namibia, a country in Africa is one of the most sparsely populated countries in the world. The Namibian economy relies on mining and agriculture for income as petroleum deposits were never found on its territory.
Recent years have seen rapid economic growth, but there are still many challenges that need to be addressed by authorities such as high unemployment rates and poverty levels.
8) Egypt (GDP per capita – 3,832 USD)
| Value | Global Ranking | |
|---|---|---|
| GDP (mil. USD) | 394,284 | 34th |
| GDP (nominal) per capita (USD) | 3,832 | 112th |
| GDP (PPP) per capita (USD) | 13,083 | 94th |
| Population | 101,804,299 | 14th |
- GDP by sector: agriculture: 11.7%, industry: 34.3%, services: 54%
- Main exports: petroleum products, cotton, textiles, metal products, chemicals, agricultural goods
The economy of Egypt relies heavily on tourism and agriculture, which account for about 20% and 10% of its GDP respectively. Tourism makes up approximately 12% of all employment in Egypt as well.
The Egyptian economy has always been a difficult one to analyze. The country’s economy relies also on remittances from Egyptians working abroad and oil imports, but the recent political instability makes these sources of income uncertain.
9) Eswatini (Swaziland) (GDP per capita – 3,710 USD)
| Million USD | Global Ranking | |
|---|---|---|
| GDP (mil. USD) | 4,226 | 158th |
| GDP (nominal) per capita (USD) | 3,710 | 115th |
| GDP (PPP) per capita (USD) | 9,152 | 114th |
| Population | 1,093,238 | 155th |
- GDP by sector: agriculture: 8.77%, industry: 33.8%, services: 53.15%
- Main exports: soft drink concentrates, sugar, wood pulp, cotton yarn, refrigerators, citrus and canned fruit
The Eswatini’s economy relies heavily on exports from sugarcane plantations. The major industries in this area are sugar, livestock farming, forestry, and fisheries.
Tourism also contributes to the country’s revenue but it is not yet a major industry for Eswatini with only about 7% of the GDP coming from tourism-related activities according to World Travel & Tourism Council data.
A large portion of its revenues come from remittances sent by nonresidents working abroad.
10) Tunisia (GDP per capita – 3,683 USD)
| Value | Global Ranking | |
|---|---|---|
| GDP (mil. USD) | 44,265 | 90th |
| GDP (nominal) per capita (USD) | 3,683 | 116th |
| GDP (PPP) per capita (USD) | 10,594 | 108th |
| Population | 11,746,695 | 80th |
- GDP by sector: agriculture: 10.1%, industry: 26.2%, services: 63.8%
- Main exports: clothing, semi-finished goods and textiles, agricultural products, mechanical goods, phosphates and chemicals, hydrocarbons, electrical equipment
The Tunisian economy relies on the tourism sector, agriculture, and trade. The country is a net importer of products from abroad.
It imports food items such as wheat, livestock, and dairy products for consumption and to support its own agricultural production.
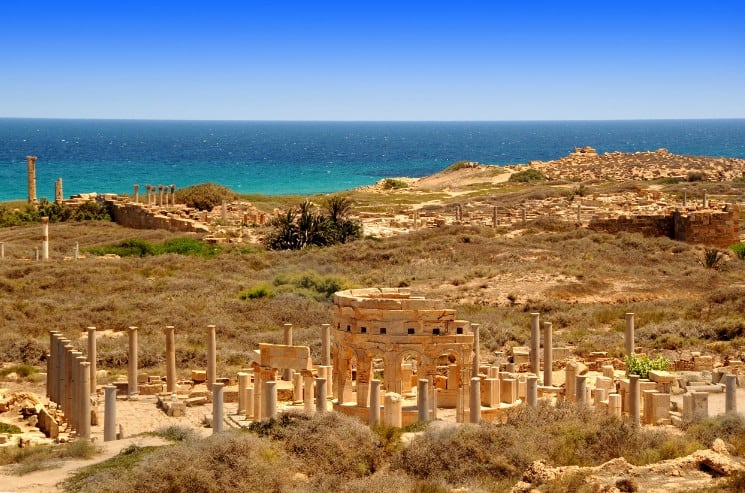
11) Libya (GDP per capita – 3,617 USD)
| Million USD | Global Ranking | |
|---|---|---|
| GDP (mil. USD) | 24,267 | 108th |
| GDP (nominal) per capita (USD) | 3,617 | 120th |
| GDP (PPP) per capita (USD) | 13,723 | 90th |
| Population | 6,959,000 | 104th |
- GDP by sector: agriculture 1.3%, industry 63.8%, services 34.9%
- Main exports: crude oil, refined petroleum products, natural gas, chemicals
Libya has one of the world’s largest oil reserves. With a population of 6 million people and an average GDP per capita of $15,800, Libya is considered a wealthy country with a relatively low level of unemployment.
However, recent conflicts have resulted in economic sanctions and instability which threaten to halt economic growth indefinitely.
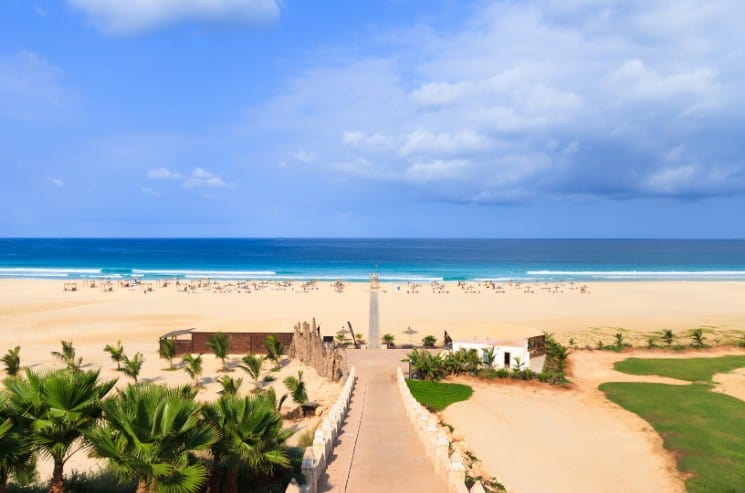
12) Cape Verde (GDP per capita – 3,555 USD)
| Million USD | Global Ranking | |
|---|---|---|
| GDP (mil. USD) | 2,003 | 169th |
| GDP (nominal) per capita (USD) | 3,555 | 122nd |
| GDP (PPP) per capita (USD) | 6,837 | 124th |
| Population | 563,198 | 166th |
- GDP by sector: agriculture: 7.9%, industry: 17.9%, services: 74.2%
- Main exports: fuel, shoes, garments, fish, hides
In the last few decades, Cabo Verde has seen a major increase in economic growth and development. This is largely thanks to the country’s dependence on tourism, fisheries, and agriculture.
One of the most important factors that has contributed to this rapid economic growth is the government’s increased investment in infrastructure projects such as roads and schools.
However, there are still many challenges for Cabo Verde including chronic food insecurity which affects over 12% of households, and high levels of inequality between men and women (less than 50%).
13) Morocco (GDP per capita – 3,415 USD)
| Value | Global Ranking | |
|---|---|---|
| GDP (mil. USD) | 124,003 | 58th |
| GDP (nominal) per capita (USD) | 3,415 | 123rd |
| GDP (PPP) per capita (USD) | 8,027 | 120th |
| Population | 36,234,708 | 39th |
- GDP by sector: agriculture: 14.8%, industry: 29.1%, services: 56%
- Main exports: clothing and textiles, automobiles, aircraft parts, electric components, inorganic chemicals, transistors, crude minerals
Morocco is a country with an economy that relies heavily on tourism and agriculture. The Moroccan government has been working to diversify the economy by investing in new industries such as renewable energy, information technology, construction, transportation, and manufacturing.
The Moroccan people have traditionally relied on their agricultural sector for employment and income so the shift towards other industries can be difficult for some of them. Other challenges include trying to create jobs in areas where there are few skills available or lack of education opportunities nearby.
14) Algeria (GDP per capita – 3,364 USD)
| Value | Global Ranking | |
|---|---|---|
| GDP (mil. USD) | 151,459 | 56th |
| GDP (nominal) per capita (USD) | 3,364 | 124th |
| GDP (PPP) per capita (USD) | 11,433 | 105th |
| Population | 44,700,000 | 32nd |
petroleum, natural gas and petroleum products- GDP by sector: agriculture: 13.3%, industry: 39.3%, services: 47.4%
- Main exports: petroleum, natural gas and petroleum products
The Algerian economy is mostly based on oil and natural gas production. In the past few years, Algeria’s economic growth has been declining due to falling global oil prices. Algeria has plenty of natural resources in its territory but it lacks industrialization and a strong agricultural sector.
Oil and gas revenues account for roughly 45% of GDP. The country is part of OPEC and was one of the founding members.
15) Djibouti (GDP per capita – 3,214 USD)
| Value | Global Ranking | |
|---|---|---|
| GDP (mil. USD) | 3,663 | 159th |
| GDP (nominal) per capita (USD) | 3,214 | 126th |
| GDP (PPP) per capita (USD) | 5,300 | 135th |
| Population | 976,107 | 156th |
- GDP by sector: Agriculture: 2.8%, Industry: 21.0%, Services: 76.1%
- Main exports: Reexports, Hides and skins, Coffee, Scrap metal
Djibouti is a small African state located just south of the Gulf of Aden. The country’s economy relies heavily on its strategic location. Djibouti is home to one of only two international shipping ports in East Africa and the Horn, as well as an important military base for the United States and France.
The richest African countries by GDP (PPP) per capita
Finally, this is a list of the richest countries in Africa by GDP (PPP) per capita:
| Country | GDP (PPP) per capita (USD) | Global Rank | |
|---|---|---|---|
| 1 | Seychelles | 26,119 | 53rd |
| 2 | Mauritius | 22,030 | 61st |
| 3 | Equatorial Guinea | 18,236 | 71st |
| 4 | Botswana | 18,113 | 73rd |
| 5 | Gabon | 16,244 | 76th |
| 6 | Libya | 13,723 | 90th |
| 7 | Egypt | 13,083 | 94th |
| 8 | South Africa | 12,442 | 99th |
| 9 | Algeria | 11,433 | 105th |
| 10 | Tunisia | 10,594 | 108th |
| 11 | Namibia | 9,542 | 113rd |
| 12 | Swaziland | 9,152 | 114th |
| 13 | Cape Verde | 8,027 | 120th |
| 14 | Angola | 6,878 | 123rd |
| 15 | Ghana | 5,968 | 129th |
Read also our other articles:
- 53 Most Interesting Facts about Cuba
- 85 Most Interesting Facts about Argentina
- 65 Most Interesting Facts about Peru
Pin this article about the richest African countries for later and to your friends:
The richest African countries by GDP
The richest African countries by GDP per capita
The richest African countries by GDP (PPP) per capita
Do you like this post – richest African countries? Share it with your friends: